The p-V diagram
1. The p-V diagram:
- The p-V diagram, also known as the pressure-volume diagram, is a graphical representation of the relationship between the pressure and volume of a system during a thermodynamic process. According to the first law of thermodynamics, the diagram illustrates the conservation of energy and the work done on or by the system.
- The first law of thermodynamics states that the change in internal energy (ΔU) is equal to the heat added to the system (Q) minus the work done by the system (W):
- [math]ΔU = Q – W [/math]
- The p-V diagram helps visualize the work done by the system and the heat transfer between the system and its surroundings, making it a powerful tool for understanding thermodynamic processes.
Table 1 First law of thermodynamic Processes with description, application equations and p-V diagrams
| Process | Description | First law of thermodynamics application | Diagrams |
|---|---|---|---|
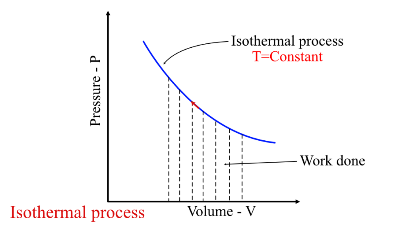
| Isothermal Expansion (Constant Temperature) |
– The system expands, and pressure decreases while volume increases. – Work is done by the system (area under the curve). – Heat is absorbed by the system |
[math]∆U = 0 \\ Q = W [/math] |
Figure 1 Isothermal p-V curve |
| Adiabatic expansion (No Heat Transfer) |
– The system expands, and pressure decreases while volume increases. – Work is done by the system (area under the curve). – No heat transfer occurs |
[math]Q = 0 \\ ∆U = -W[/math] | 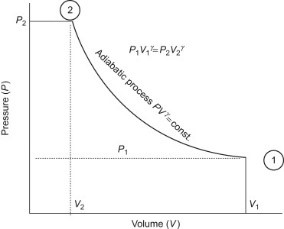 Figure 2 Adiabatic process p-V curve |
|
Isobaric Expansion (Constant Pressure) |
– The system expands, and volume increases while pressure remains constant. – Work is done by the system (area under the curve). – Heat is absorbed by the system |
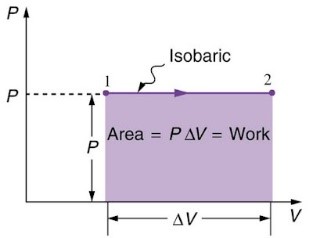 Figure 3 Isobaric p-V diagram |
|
| Isochoric Process (Constant Volume) |
– No work is done by the system (W = 0). – Heat is absorbed or released by the system |
[math]W = 0 \\ W = ∆U [/math] | 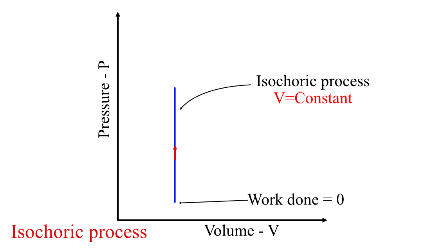 Figure 4 Isochoric process p-V curve |
2. Extension to cyclic processes:
- When extending the p-V diagram to cyclic processes, the work done per cycle is equal to the area enclosed by the loop. This is a fundamental concept in thermodynamics, as it allows us to calculate the net work done by a system over a complete cycle.
- In a cyclic process, the system returns to its initial state, and the net work done is the area enclosed by the loop in the p-V diagram. This area represents the total work done by the system during the cycle, taking into account both the expansion and compression strokes.
- [math]\text{Work done per cycle} = \text{area of loop} \\ W_{\text{cycle}} = \oint p \, dV[/math]
- – Where p is the pressure, V is the volume, and the integral is taken over the complete cycle.
- The area inside the loop can be positive or negative, depending on the direction of the cycle. A clockwise cycle produces a positive area, indicating that work is done by the system, while a counterclockwise cycle produces a negative area, indicating that work is done on the system.
3. A four-stroke petrol engine cycle and a diesel engine cycle:
- The four-stroke petrol engine cycle and diesel engine cycle, as well as their corresponding indicator diagrams.
- ⇒ Four-Stroke Petrol Engine Cycle:
- Intake Stroke (Downward motion of the piston):
- – Air-fuel mixture is drawn into the cylinder through the intake valve.
- – The intake valve opens, and the piston moves downward, creating a vacuum.
- – The air-fuel mixture is drawn into the cylinder, and the intake valve closes.
- Compression Stroke (Upward motion of the piston):
- – The air-fuel mixture is compressed by the piston, creating a high pressure and temperature.
- – The spark plug ignites the mixture, causing a small explosion.
- Power Stroke (Downward motion of the piston):
- – The explosion forces the piston downward, rotating the crankshaft.
- – The power stroke is the stroke that produces the power to propel the vehicle.
- Exhaust Stroke (Upward motion of the piston):
- – The piston pushes the exhaust gases out of the cylinder through the exhaust valve.
- – The exhaust valve opens, and the piston moves upward, expelling the exhaust gases.
- ⇒ Indicator Diagram:
- The indicator diagram for a four-stroke petrol engine shows the pressure and volume changes during each stroke.
- – Compression Curve: Shows the pressure increase during the compression stroke.
- – Power Curve: Shows the pressure decrease during the power stroke.
- – Exhaust Curve: Shows the pressure decrease during the exhaust stroke.
- – Intake Curve: Shows the pressure increase during the intake stroke.
- ⇒ Diesel Engine Cycle:
- Intake Stroke (Downward motion of the piston):
- – Air is drawn into the cylinder through the intake valve.
- – The intake valve opens, and the piston moves downward, creating a vacuum.
- Compression Stroke (Upward motion of the piston):
- – The air is compressed by the piston, creating a high pressure and temperature.
- – Fuel is injected into the cylinder at the top of the compression stroke.
- Power Stroke (Downward motion of the piston):
- – The fuel ignites, causing a rapid expansion of gases, which forces the piston downward.
- Exhaust Stroke (Upward motion of the piston):
- – The piston pushes the exhaust gases out of the cylinder through the exhaust valve.
- ⇒ Indicator Diagram:
- The indicator diagram for a diesel engine shows the pressure and volume changes during each stroke.
- – Compression Curve: Shows the pressure increase during the compression stroke.
- – Fuel Injection Curve: Shows the fuel injection pressure and timing.
- – Power Curve: Shows the pressure decrease during the power stroke.
- – Exhaust Curve: Shows the pressure decrease during the exhaust stroke.
- The diesel engine cycle has a higher compression ratio than the petrol engine cycle, resulting in a higher efficiency and torque output.

Figure 5 A four-stroke petrol engine cycle and a diesel engine cycle- ⇒ Difference between petrol engine and diesel engine:
- – Fuel Type: Petrol engines use petrol (gasoline) as fuel, while diesel engines use diesel fuel.
- – Combustion Process: Petrol engines use spark ignition, where a spark plug ignites a mixture of air and fuel. Diesel engines use compression ignition, where the fuel is injected into the cylinder and ignites due to high compression.
- – Compression Ratio: Diesel engines have a higher compression ratio (18-22:1) than petrol engines (8-10:1).
- – Power and Torque: Diesel engines produce more torque and towing capacity than petrol engines, but less horsepower.
- – Fuel Efficiency: Diesel engines are generally more fuel-efficient than petrol engines, especially for long-distance driving or heavy-duty applications.
- – Engine Durability: Diesel engines are built to withstand higher compression ratios and cylinder pressures, making them more durable and longer-lasting than petrol engines.
- – Noise and Vibration: Diesel engines are generally noisier and produce more vibration than petrol engines.
- – Emissions: Diesel engines typically produce more nitrogen oxides (NOx) and particulate matter (PM) than petrol engines, but less carbon monoxide (CO) and hydrocarbons (HC).
- – Fuel Cost: Diesel fuel is generally more expensive than petrol, but diesel engines’ better fuel efficiency can offset this cost.
4. Comparison with the theoretical diagrams for these cycles:
- Theoretical diagrams for petrol and diesel engine cycles are idealized representations of the processes involved. Indicator diagrams, on the other hand, are actual measurements of the pressure and volume changes in the engine cylinders.
- The actual indicator diagrams with the theoretical diagrams for the petrol and diesel engine cycles.
- ⇒ Petrol Engine Cycle:
- Theoretical Diagram:
- – Idealized compression and expansion curves
- – Instantaneous combustion at top dead center (TDC)
- – Constant volume combustion
- Actual Indicator Diagram:
- – Deviations from idealized compression and expansion curves due to friction, heat transfer, and other losses
- – Non-instantaneous combustion, resulting in a more gradual pressure increase
- – Volume change during combustion due to piston movement
- ⇒Theoretical discussion:
- Figure 6 representation of 4 stroke petrol engine cycle

Figure 6 Theoretical diagram for four stroke petrol engine cycle - – A-B – The gas is compressed adiabatically.
- – B-C – Heat is supplied, volume is kept constant
- – C-D – The gas expands adiabatically (and therefore cools)
- – D-A – The system is cooled at a constant volume
- ⇒Diesel Engine Cycle:
- Theoretical Diagram:
- – Idealized compression and expansion curves
- – Instantaneous fuel injection and combustion at TDC
- – Constant pressure combustion
- Actual Indicator Diagram:
- – Deviations from idealized compression and expansion curves due to friction, heat transfer, and other losses
- – Non-instantaneous fuel injection and combustion, resulting in a more gradual pressure increase
- – Volume change during combustion due to piston movement
- ⇒Theoretical discussion:
- Theoretically discussion in according to figure 7 for diesel engine

Figure 7 Theoretical diagram for four stroke diesel engine cycle - – A-B – The gas is compressed adiabatically
- – B-C – Heat is supplied, pressure is kept constant.
- – C-D – The expands adiabatically (and therefore cools).
- – D-A – The system is cooled at constant volume.
- Using indicator diagrams to predict and measure power and efficiency:
- – Input power (IP) can be calculated using the calorific value (CV) of the fuel and the fuel flow rate (FFR):
- [math]Input power = Calorific value × Fue flow rate [/math]
- This equation represents the energy input into the engine through fuel combustion.
- The calorific value (CV) is a measure of the energy content of the fuel, and the fuel flow rate (FFR) is the rate at which fuel is consumed by the engine.
- The actual indicator diagrams are shown in figure 8. As we can see, the most distinct differences between the petrol and diesel diagrams are that there is not a sharp peak at the start of the expansion stroke (C-D) for the diesel engine.

- Figure 8 Actual diagram about petrol and diesel engine
5. Efficiency of petrol and diesel engine:
- The efficiency of petrol and diesel engines can be calculated using the following formulas:
- Engine Efficiency:
- [math] \text{Indicated efficiency } (\eta_i) = \left( \frac{\text{Indicated power}}{\text{Input power}} \right) \times 100\% \\ \text{Brake efficiency } (\eta_b) = \left( \frac{\text{Brake power}}{\text{Input power}} \right) \times 100\% [/math]
- Typical efficiency values for petrol and diesel engines are:
- Petrol Engine:
- – Indicated efficiency ([math]\eta_i[/math]): 25-35%
- – Brake efficiency ([math]\eta_b[/math]): 18-25%
- Diesel Engine:
- – Indicated efficiency ([math]\eta_i[/math]): 30-40%
- – Brake efficiency ([math]\eta_b[/math]): 22-30%
- These values are approximate and can vary depending on engine design, operating conditions, and other factors.
- The efficiency of an engine is affected by various factors, including:
- – Compression ratio
- – Fuel type and quality
- – Engine design and technology
- – Operating conditions (speed, load, temperature, etc.)
- – Frictional losses
- – Heat transfer and energy losses
- Improving engine efficiency is crucial for reducing fuel consumption, emissions, and environmental impact. Engineers use various techniques to optimize engine performance, such as:
- – Advanced materials and coatings
- – Improved combustion chamber design
- – Enhanced fuel injection systems
- – Turbocharging and supercharging
- – Waste heat recovery systems
- – Friction reduction technologies
- By understanding the efficiency of petrol and diesel engines, we can better appreciate the challenges and opportunities for improvement in engine technology.
- ⇒ Overall efficiency ([math]\mu_0[/math])
- The ratio of output power (brake power) to input power (fuel energy)
- [math]\text{Overall efficiency } (\mu_0) = \frac{\text{Brake power}}{\text{Fuel power}} [/math]
- ⇒ Thermal efficiency([math]\mu_{\text{th}}[/math])
- The ratio of output power to the heat energy released by combustion.
- [math]\text{Thermal efficiency } (\mu_{\text{th}}) = \frac{\text{Brake power}}{\text{Heat power}}[/math]
- Thermal efficiency is affected by factors like combustion chamber design, fuel type, and engine temperature.
- ⇒ Mechanical efficiency ([math]\mu_m [/math])
- The ratio of output power to the power developed in the cylinders (indicated power).
- [math]\text{Mechanical efficiency } (\mu_m) = \frac{\text{Brake power}}{\text{Indicated power}}[/math]
- Mechanical efficiency is influenced by frictional losses, engine design, and accessory loads.
6. Indicated power:
- The indicated power is the net work done by the engine each second or simply the power developed by the engine. In order to calculate this this, calculate the number of cycles occurring in the engine per second:
- [math]\text{Number of cycles per second} = \frac{1}{\text{time for one cycle}}[/math]
- The equation for indicated power (IP) in more detail:
- [math]\text{IP} = (\text{Area of } p\text{-}V \text{ loop}) \times (\text{Number of cycles per second}) \times (\text{Number of cylinders}) [/math]
- Area of p-V loop:
- – The p-V loop represents the pressure-volume relationship in a cylinder during a cycle.
- – The area enclosed by the loop is the work done per cycle (in joules, J).
- – The area is calculated by integrating the pressure (p) with respect to volume (V) over the cycle.
- Number of cycles per second (Engine Speed):
- – This is the number of times the engine completes a cycle per second (in hertz, Hz).
- – It’s the engine speed, typically measured in revolutions per minute (RPM) or hertz (Hz).
- Number of cylinders:
- – This is the total number of cylinders in the engine.
- – Each cylinder contributes to the total power output.
- By multiplying these three factors together, we get the indicated power (IP), which represents the power produced by the engine:
- [math]\text{IP} = (\text{Work done per cycle}) \times (\text{Engine speed}) \times (\text{Number of cylinders}) [/math]
- This equation helps us understand how the engine’s power output is related to its pressure-volume characteristics, engine speed, and cylinder configuration.
7. Output or brake power,[math]P = Tω[/math]
- The output or brake power (P) can be calculated using the torque (T) and angular velocity (ω) as follows:
- [math]P = Tω[/math]
- Where:
- – P is the output or brake power (in watts, W)
- – T is the torque (in newton-meters, N . m )
- – ω is the angular velocity (in radians per second, rad/s)
- Torque (T) is the rotational force that causes the engine’s crankshaft to rotate. It’s a measure of the engine’s twisting force.
- Angular velocity (ω) is the rate of change of angular displacement with respect to time. It’s a measure of how fast the engine’s crankshaft is rotating.
- The multiply of torque and angular velocity, then get the output or brake power, which is the actual power delivered by the engine to the load.
- – Torque (T) is the product of the force (F) and the distance (r) from the axis of rotation:[math]T = F × r [/math]
- – Angular velocity (ω) is the derivative of angular displacement (θ) with respect to time (t):[math]ω = dθ/dt [/math]
- – Power (P) is the rate of doing work (W) with respect to time (t):[math]P = dW/dt[/math]
- Substituting the equations for torque and angular velocity into the power equation, we get:
- [math] P = Tω = (F × r) × (dθ/dt)[/math]
- This equation shows that power is the product of the force, distance, and angular velocity. It’s a fundamental concept in physics and engineering, relating the engine’s performance to its torque, speed, and power output.