-
SECTION A
-
Answer ALL questions.
- All multiple choice questions must be answered with a cross in the box for the correct answer from A to D. If you change your mind about an answer, put a line through the box and then mark your new answer with a cross.
- 1. Which of the following provides evidence for the particle model of electromagnetic radiation?
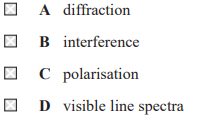
- Answer: D
- Explain:
- Diffraction, interference, and polarisation are all phenomena that provide evidence for the wave model of electromagnetic radiation.
- Visible line spectra, also known as atomic line spectra, can only be explained if electromagnetic (EM) radiation is assumed to behave as particles (photons).
- The specific wavelengths of light emitted or absorbed by atoms provide evidence for the quantization of energy levels within atoms, a concept central to the particle nature of light. Other evidence for the particle nature of light includes the photoelectric effect.
- 2. In an investigation to determine the Young modulus of steel in the form of a wire, a student plots a straight line graph. The Young modulus is numerically equal to the gradient of the graph.
- What quantities did the student plot on each axis on the graph?
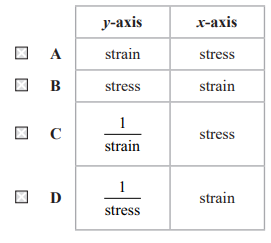
- Answer: B
- Explain:
- The Young modulus (E) is defined as the ratio of stress (σ) to strain (ϵ) as given by the formula:
- [math]E=\frac{\sigma}{\epsilon}[/math]
- The problem states that the Young modulus is numerically equal to the gradient of a straight-line graph. A straight-line graph follows the equation
- [math]y=mx+c[/math]
- Where m is the gradient. If the line passes through the origin (which is the case for a stress-strain graph within the elastic limit), then,[math]c=0[/math],and
- [math]y=mx[/math]
- Comparing the two equations, if E is the gradient (m), then stress (σ) must be the quantity plotted on the y-axis (y) and strain (ϵ) must be the quantity plotted on the x-axis (x).
- [math]\sigma=E\epsilon[/math]
- 3. Which of the following is the SI base unit for the Planck constant?
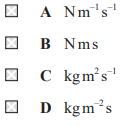
- Answer: C
- Explain:
- Using the K.E energy formula
- [math]\text{K.E}=\frac{1}{2}mv^2[/math]
- Using units
- [math]\text{K.E}=\frac{1}{2}(\text{kg})(\text{m/s})^2[/math]
- [math]\text{K.E}=\text{kg m}^2\text{s}^{-2}[/math]
- By using the Planck’s constant equation:
- [math]E=hf[/math]
- [math]E=h\frac{1}{T}[/math]
- [math]h=ET[/math]
- Using formula:
- [math]h=(\text{kg m}^2\text{s}^{-2})\text{s}[/math]
- [math]h=\text{kg m}^2\text{s}^{-1}[/math]
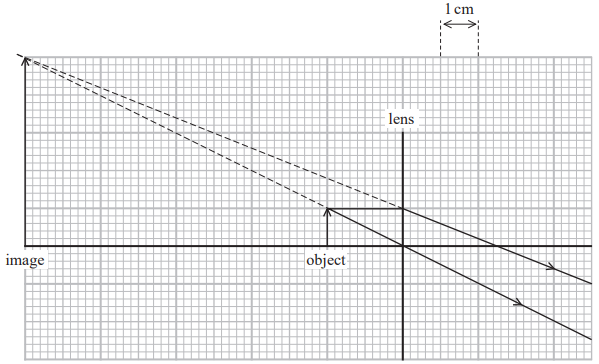
- 4. A ray diagram, drawn to scale, is used to locate the size and position of an image formed by a lens as shown.
- Which row in the table gives the focal length and the type of lens?
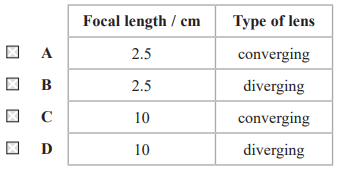
- Answer: A
- Explain:
- The diagram shows a converging (convex) lens because the parallel ray of light entering the lens is refracted towards the principal axis (it converges). A diverging (concave) lens would refract the ray away from the principal axis.
- The focal length ([math]f[/math]) is the distance from the center of the lens to the focal point, which is where the parallel ray intersects the principal axis after refraction. Using the scale provided (1 cm per two grid squares):
- The distance from the lens to the intersection point (focal point) is 5 grid squares.
- [math]5 \text{ gird squares}\times(1\text{cm}/2\text{grid squares})=2.5 \text{ cm}[/math]
- 5. A student measures the diameter of a steel wire in order to determine the cross sectional area of the wire. The percentage uncertainty in the measurement of the diameter was 1.8%.
- Which of the following is the percentage uncertainty in the value for the cross sectional area?
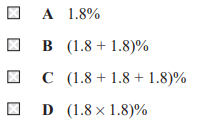
- Answer: B
- Explain:
- Understand the relationship between area and diameter
- The formula for the cross-sectional area ([math]A[/math]) of a wire, given its diameter ([math]d[/math]) is:
- [math]A=(\pi d^2)/4[/math]
- [math]A\propto d^2[/math]
- Given that the percentage uncertainty in the diameter ([math]d[/math]) is 1.8 %
- The area depends on [math]d^2[/math] the percentage uncertainty in the area is:
- Total % uncertainty of diameter = [math]2\times[/math] % uncertainty in [math]d[/math]
- Total % uncertainty of diameter = [math]2\times 1.8[/math] %
- This is equivalent to:
- [math]1.8+1.8[/math] %
- 6. A two beam oscilloscope is used to display signals from two microphones as shown.
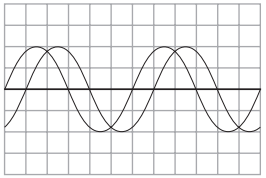
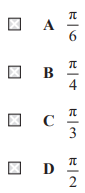
- Which of the following could be the phase difference in radians between the traces?
- Answer: C
- Explain:
- – One full wavelength (or period) corresponds to 4 horizontal divisions on the oscilloscope screen. This represents a phase difference of [math]2\pi[/math] radians.
- – The horizontal shift between the two waves is approximately [math]\frac{2}{3}[/math] of a division (e.g., from the first wave’s peak at 1 division to the second wave’s peak at [math]1+\frac{2}{3}[/math] divisions).
- – The phase difference in radians is calculated as:
- Phase difference = (Horizontal shift)/Wavelength × [math]2\pi[/math]
- Phase difference = ([math]\frac{2}{3}[/math] divisions)/(4 divisions) × [math]2\pi[/math]
- Phase difference = [math]\frac{2}{12}\times2\pi[/math]
- Phase difference = [math]\frac{1}{6}\times2\pi[/math]
- Phase difference = [math]\frac{\pi}{3}[/math]
- 7. The energy level diagram shows four possible energy transitions for an electron in an atom.
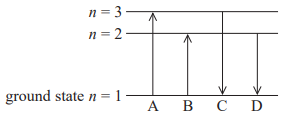
- Which arrow shows the transition made by the electron when the atom emits radiation with the longest wavelength?
- Answer: D
- Explain:
- The energy of a photon emitted during an electron transition is related to its wavelength by the equation
- [math]E=\frac{hc}{\lambda}[/math]
- Where [math]h[/math] is Planck’s constant, [math]c[/math] is the speed of light, [math]E[/math] is the energy difference between levels, and [math]\lambda[/math] is the wavelength.
- Emission vs. Absorption:
- Emission of radiation occurs when an electron moves from a higher energy level to a lower energy level. Transitions A and B represent absorption, as the electron moves to a higher energy state. Transitions C and D represent emission.
- Energy and Wavelength:
- The longest wavelength corresponds to the smallest energy difference.
- Comparing Transitions:
- Transition D involves a smaller energy difference (from [math]n=2[/math] to [math]n=1[/math]) than transition C (from [math]n=3[/math] to [math]n=1[/math]).
- 8. A displacement time graph is shown for a particle in a transverse wave.
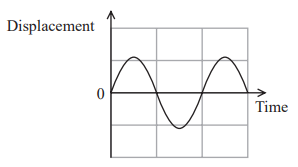
- Which property of the wave can not be determined directly from the displacement time graph?
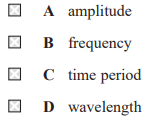
- Answer: D
- Explain:
- A displacement-time graph plots the vertical displacement of a single point on a wave over time.
- Amplitude:
- – The maximum displacement from the equilibrium position (the horizontal axis) can be read directly from the vertical axis.
- Time period:
- – The time taken for one complete oscillation or cycle can be read directly from the horizontal (time) axis.
- Frequency:
- – This is the reciprocal of the time period
- [math]f=\frac{1}{T}[/math]
- So, it can be calculated from the time period value obtained from the graph.
- Wavelength:
- – This is the spatial distance between two corresponding points on consecutive waves (e.g., crest to crest). A displacement-time graph only provides information about the variation with time at one location, not the variation with distance across space. Therefore, the wavelength cannot be determined from this graph alone.
- 9. A student used a diffraction grating to determine the wavelength of the light emitted by a laser. Light from the laser passed through the diffraction grating and the student observed a pattern on a wall 4 m away. The pattern consisted of a central maximum and 1st and 2nd order maxima as shown.
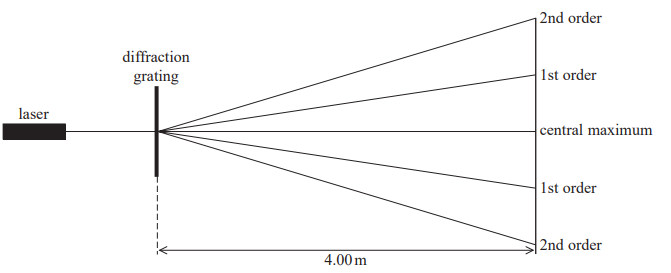
- The student measured the distance between the central and a 2nd order maximum as 1350 mm. The diffraction grating had 300 slits mm⁻¹.
- (a) The colours and corresponding wavelengths of light emitted by commonly used lasers are given in the table.
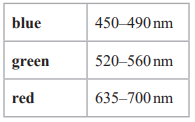
- Deduce the colour of the laser light the student used in this experiment. (4)
- Explain:
- – The diffraction grating = 300 slits per mm
- – Slit spacing = [math]d[/math] = ?
- [math]d=\frac{1}{\text{number of slits per unit length}}[/math]
- [math]d=\frac{1}{300}\times10^{3}[/math] m
- [math]d=3.33\times10^{-6}[/math] m
- Calculate the angle to the second order maximum:
- – The distance from the grating to the wall = [math]L=4.00[/math] m
- – The distance from the central to the second order maximum =[math]x=1350[/math] mm = [math]1.35[/math] m
- tanθ=x/L
- [math]\tan \theta = \frac{x}{L}[/math]
- [math]\theta = \tan^{-1}\left(\frac{x}{L}\right)[/math]
- [math]\theta = \tan^{-1}\left(\frac{1.35}{4.00}\right)[/math]
- [math]\theta = \tan^{-1}(0.3375)[/math]
- [math]\theta = 18.64^{0}[/math]
- Calculate the wavelength,
- – Using the diffraction grating equation
- [math]d \sin \theta = n\lambda[/math]
- – Where [math]n = 2[/math] for the second order maximum:
- [math]\lambda = \frac{d \sin \theta}{n}[/math]
- [math]\lambda = \frac{(3.33 \times 10^{-6}) \sin 18.64^{0}}{2}[/math]
- [math]\lambda = \frac{(3.33 \times 10^{-6})(0.319)}{2}[/math]
- [math]\lambda = 5.31 \times 10^{-7}\ \text{m}[/math]
- [math]\lambda = 531 \times 10^{-9}\ \text{m}[/math]
- [math]\lambda = 531\ \text{nm}[/math]
- The calculated wavelength of [math]531\ \text{nm}[/math] falls within the range for green light.
- (b) Measuring the distance between the two 2nd order maxima would produce a smaller percentage uncertainty in the value of wavelength.
- Give a reason why. (1)
- Explain:
- The distance is larger
- The percentage uncertainty is calculated as
- [math]\left(\frac{\text{Uncertainty}}{\text{measured value}}\right)\times 100[/math]%
- Measuring the distance between the two 2nd order maxima results in a larger measured distance (double the distance from the center to one maximum). Since the absolute uncertainty of the measuring instrument typically remains the same, dividing by a larger measured value (the distance between the two maxima) leads to a smaller percentage uncertainty.
- 10. In 1969, astronauts placed an array of mirrors on the surface of the Moon. Scientists can use these to monitor the distance from Earth to the Moon. Light from a laser is used with a pulse echo technique.
- Describe how the distance of the Moon from Earth can be determined using a pulse echo technique.
- Explain:
- The distance of the Moon from Earth is determined by measuring the time it takes for a laser pulse to travel from Earth to the Moon and back, and then using the formula
- [math]d = \frac{c \times t}{2}[/math]
- The pulse-echo technique, also known as laser ranging, involves the following steps to determine the distance to the Moon:
- – A powerful, brief laser pulse is transmitted from an observatory on Earth towards the retroreflector array placed on the Moon’s surface by astronauts.
- – The time interval (t) between sending the pulse and receiving the reflected pulse back at the Earth observatory is precisely measured.
- – The speed of the laser light (c) through space is a known constant value, approximately [math]3.0 \times 10^{8}\ \text{m/s}[/math].
- – The total distance traveled by the light is calculated using the formula:
- Total distance = Speed of light × time
- [math]\text{Total distance} = c \times t[/math]
- Since the total distance is a round trip (Earth to Moon and back to Earth), the actual distance (d) from Earth to the Moon is half of the total distance traveled:
- [math]d = \frac{c \times t}{2}[/math]
- 11. A student used steel ball bearings falling through a viscous liquid to investigate the relationship between the terminal velocity [math]v[/math] of a ball bearing and its radius [math]r[/math].
- (a) The student used ball bearings with different radii.
- Describe how the student can make measurements of the ball bearing to determine its radius. (3)
- Explain:
- Use a micrometer screw gauge to measure the diameter of the ball bearing in several different directions and then calculate the average diameter. The radius is then half of the average diameter.
- – A micrometer screw gauge is used because it has a high precision (typically to [math]0.01\ \text{mm}[/math]), necessary for accurate measurement of a small object like a ball bearing.
- – Measuring the diameter in multiple directions helps to account for any slight non-uniformity in the shape of the ball bearing, reducing random error.
- – The average of these diameter measurements provides a more reliable value for the true diameter.
- – The radius [math]r[/math] is calculated using the formula
- [math]r = \frac{D_{\text{average}}}{2}[/math]
- – [math]D_{\text{average}}[/math] is the average diameter.
- (b) A free body force diagram for a ball bearing of radius [math]5.00\ \text{mm}[/math] falling through the liquid is shown. The upthrust on the ball bearing has been ignored.
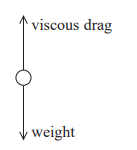
- (i) Show that the weight of a ball bearing with a radius of [math]5.0\ \text{mm}[/math] is about [math]4 \times 10^{-2}\ \text{N}[/math].
- Density of steel = [math]8.0 \times 10^{3}\ \text{kg m}^{-3}[/math] (3)
- Explain:
- – Density of steel = [math]8.0 \times 10^{3}\ \text{kg m}^{-3}[/math]
- – Calculate the Volume of the ball bearing = [math]V = ?[/math]
- [math]V = \frac{4}{3}\pi r^{3}[/math]
- [math]V = \frac{4}{3}(3.14)(5.0 \times 10^{-3})^{3}[/math]
- [math]V = 5.236 \times 10^{-7}\ \text{m}^{3}[/math]
- – Calculate the mass of the ball bearing = [math]m = ?[/math]
- [math]\text{Density} = \frac{\text{Mass}}{\text{Volume}}[/math]
- [math]8.0 \times 10^{3} = \frac{\text{Mass}}{5.236 \times 10^{-7}}[/math]
- [math]\text{Mass} = (5.236 \times 10^{-7})(8.0 \times 10^{3})[/math]
- [math]\text{Mass} = 4.188 \times 10^{-3}\ \text{kg}[/math]
- – Calculate the weight of the ball bearing = [math]W = ?[/math]
- [math]W = mg[/math]
- [math]W = (4.188 \times 10^{-3})(9.8)[/math]
- [math]W = 4.108 \times 10^{-3}\ \text{N}[/math]
- (ii) Calculate the terminal velocity of the ball bearing as it falls through the liquid. You may ignore the upthrust on the ball bearing.
- Viscosity of liquid = [math]1.8\ \text{Pa s}[/math] (2)
- Explain:
- – Radius = [math]r = 5.00\ \text{mm} = 5.00 \times 10^{-3}\ \text{m}[/math]
- – Viscosity [math]\eta = 1.8\ \text{Pa s}[/math]
- – The density of steel = [math]\rho = 7850\ \text{kg m}^{-3}[/math]
- – Mass [math]m = \rho V[/math]
- – The viscous drag force = [math]F_d = W[/math]
- By using Stoke’s Law:
- [math]F_d = 6\pi \eta r v[/math]
- [math]W = mg[/math]
- [math]6\pi \eta r v = mg[/math]
- [math]m = \rho V[/math]
- [math]m = \rho \frac{4}{3}\pi r^{3}[/math]
- [math]6\pi \eta r v = \left(\rho \frac{4}{3}\pi r^{3}\right) g[/math]
- [math]v = \frac{\left(\rho \frac{4}{3}\pi r^{3}\right) g}{6\pi \eta r}[/math]
- [math]v = \frac{2\rho r^{2} g}{9\eta}[/math]
- Put all values
- [math]v = \frac{2(7850)(5.00 \times 10^{-3})^{2}(9.8)}{9(1.8)}[/math]
- [math]v = \frac{3.8465}{16.2}[/math]
- [math]v = 0.24\ \text{m s}^{-1}[/math]
- Terminal velocity = [math]0.24\ \text{m s}^{-1}[/math]
- (c) Explain how the student can ensure that Stokes’ law will apply to the ball bearings falling through the viscous liquid. (2)
- Explain:
- The fluid flow must be laminar and the ball bearings must be spherical and small enough to ensure a low Reynolds number.
- Stokes’ law describes the drag force on a sphere moving through a viscous fluid under specific conditions. To ensure the law applies, the student should maintain:
- Laminar flow:
- – The liquid should be very viscous, and the ball bearings should fall at low speeds to avoid turbulent flow.
- Small, smooth, spherical objects:
- – Stokes’ law is derived for small, smooth, spherical particles.
- Large container:
- – The container must be large enough so that the effects of the walls on the fluid flow are negligible.
- Infinite medium:
- – The depth of the liquid should be sufficient to allow the ball to reach terminal velocity within the uniform flow region.
- 12. The power of the lens in the human eye changes as the lens changes shape. This enables a person to see objects at different distances clearly. To change the shape, muscles in the eye put the lens under stress.
- (a) A stress strain graph for the eye lens for people of different ages is shown.
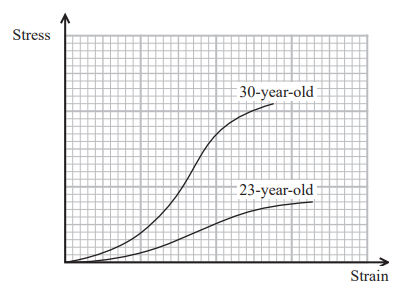
- (i) State one difference between the lens of a 23 year old and the lens of a 30 year old. (1)
- Explain:
- The lens of a 23-year-old is more elastic than the lens of a 30-year-old.
- – The stress-strain graph shows that for the same amount of stress applied, the 23-year-old lens undergoes a larger strain (change in shape) compared to the 30-year-old lens.
- – This indicates that the younger lens is more flexible or elastic, meaning it can change shape more easily.
- – As people age, the lens naturally becomes harder and less flexible, a condition known as presbyopia.
- – This reduced elasticity limits the ability of the ciliary muscles to change the lens’s shape, which is necessary for focusing on objects at different distances.
- (ii) Give a reason for your answer, making reference to the graph. (1)
- Explain:
- The 30-year-old lens requires more stress to achieve the same strain (deformation) as the 23-year-old lens.
- – The graph shows that for any given value of strain (deformation), the corresponding stress value on the 30-year-old curve is higher than on the 23-year-old curve.
- – This indicates the older lens is stiffer or less elastic, requiring more force (stress) from the ciliary muscles to change shape (strain) for focusing.
- – The reduced elasticity with age makes accommodation (focusing on near objects) more difficult, a condition known as presbyopia.
error: Content is protected !!