
18 May 2018
- SECTION A
Answer ALL questions. - For questions 1-8, select one answer from A to D and put a cross in the box. If you change your mind, put a line through the box and then mark your new answer with a cross.
- 1. The Young Modulus of a material can be expressed by the formula
- [math]E=\dfrac{Fx}{A\Delta x}[/math]
- The derivation of this formula is
- [math]E=\dfrac{\sigma}{\varepsilon}[/math]
- So,
- [math]E=\cdots[/math]
- And
- [math]E=\dfrac{Fx}{A\Delta x}[/math]
- Which of the following completes the second line of the derivation?
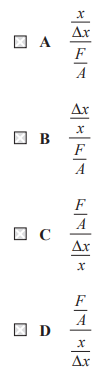
- Answer: C
- Explain:
The Young’s Modulus [math]E[/math] is defined as the ratio of stress - [math]\sigma[/math] to strain [math]\varepsilon[/math].
[math]\sigma=\dfrac{F}{A}[/math]
[math]\varepsilon=\dfrac{\Delta x}{x}[/math] - Where [math]F[/math] is the force [math]A[/math] is the cross-sectional area, [math]\Delta x[/math] is the change in length, and [math]x[/math] is the original length.
Substitute the expressions for stress and strain into the formula for Young’s Modulus, - [math]E=\dfrac{\sigma}{\varepsilon}[/math]
- Putting values
- [math]E=\dfrac{(F/A)}{(\Delta x/x)}[/math]
- 2. Fishermen use ultrasound pulses to detect shoals of fish under the surface of the water. Some fish are at a depth of 90 m below the surface.
Which of the following is the expression for the time [math]t[/math], in seconds, between the transmitted and the received pulse?
Speed of sound in water = [math]1500,\text{m s}^{-1}[/math] 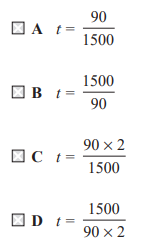
- Answer: C
- Explain:
- – Depth of the fish = [math]90,\text{m}[/math]
- – Total distance traveled is twice the depth
- [math]d=2\times90[/math]
[math]d=180,\text{m}[/math] - – Speed of sound = [math]v=1500,\text{m s}^{-1}[/math]
- [math]d=vt[/math]
[math]t=\dfrac{d}{v}[/math]
[math]t=\dfrac{180}{1500}[/math]
[math]t=\dfrac{2\times90}{1500}[/math] - 3. Which of the following is a correct statement about a stationary wave?
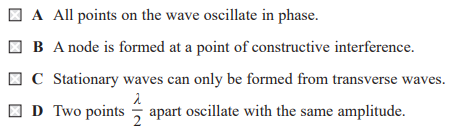
- Answer: D
- Explain:
A stationary wave, also known as a standing wave, is formed by the superposition of two identical waves traveling in opposite directions. - 4. Einstein’s photoelectric equation states
- [math]hf=\phi+\dfrac{1}{2}mv_{\text{max}}^{2}[/math]
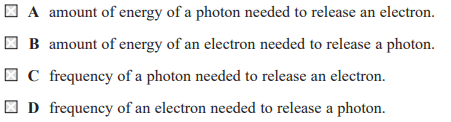
- The quantity denoted by [math]\phi[/math] is the minimum
- Answer: A
- Explain:
Einstein’s photoelectric equation is given by: - [math]hf=\phi+\dfrac{1}{2}mv_{\text{max}}^{2}[/math]
- In this equation, [math]hf[/math] is the energy of the incident photon, [math]\dfrac{1}{2}mv_{\text{max}}^{2}[/math] is the maximum kinetic energy of the emitted electron, and [math]\phi[/math] is the work function. The work function [math]\phi[/math] represents the minimum energy required to remove an electron from the surface of a metal. This is the minimum amount of energy a photon must have to release an electron from the material.
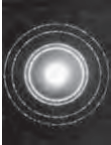
- 5. The image shows a diffraction pattern formed when a beam of electrons passes through thin metal foil.
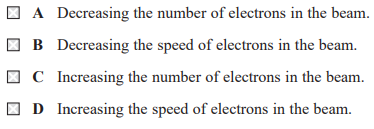
- Which of the following would cause the diameter of the rings to increase?
- Answer: B
- Explain:
The diameter of the diffraction rings is related to the de Broglie wavelength of the electrons. The de Broglie wavelength is inversely proportional to the momentum of the particle, as shown by the equation: - [math]\lambda=\dfrac{h}{p}[/math]
- Where [math]h[/math] is plank’s constant.
- Momentum is the product of mass ([math]m[/math]) and velocity ([math]v[/math]):
- [math]p=mv[/math]
- Therefore, the de Broglie wavelength can also be expressed as
- [math]\lambda=\dfrac{h}{p}[/math]
[math]\lambda=\dfrac{h}{mv}[/math] - This shows that the wavelength is inversely proportional to the speed of the electron.
- The diameter of the diffraction rings is directly proportional to the wavelength. A larger wavelength results in a larger diameter. Therefore, to increase the diameter of the rings, the wavelength must be increased. This can be achieved by decreasing the speed of the electrons in the beam.
- 6. The graphs show the position of two identical waves at a time [math]t[/math].
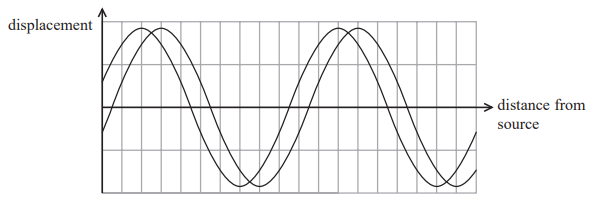
Which of the following is the phase difference between these two waves?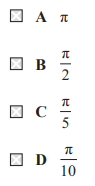
- Answer: C
- Explain:
The phase shift ([math]\Delta x[/math]) is the horizontal distance between the two waves. The second wave is shifted to the right relative to the first wave. - [math]\Delta x=1[/math] grid units
The phase difference ([math]\phi[/math]) is calculated using the formula
[math]\phi=\dfrac{\Delta x}{\lambda}\times2\pi[/math]
[math]\phi=\dfrac{1}{10}\times2\pi[/math]
[math]\phi=\dfrac{\pi}{5}[/math]
- Questions 7 and 8 refer to an experiment to investigate stationary waves on a string.
- A string of length l, fixed at both ends, is placed under tension T and plucked. The fundamental frequency f of the vibrating string is measured and the speed v of the wave on the string is calculated.
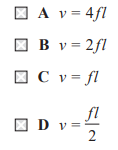
- 7. Which of the following gives the speed of the wave?
- Answer: B
- Explain:
- The speed of a wave is related to its frequency and wavelength by the equation
- [math]v=f\lambda[/math]
- For a string of length l that is fixed at both ends, the fundamental frequency (first harmonic) corresponds to a standing wave with a single loop (one antinode) and two nodes at the ends. The length of the string (l) is equal to half a wavelength. Therefore, the wavelength λ is twice the length of the string.
- [math]\lambda=2l[/math]
- [math]v=f(2l)[/math]
- [math]v=2fl[/math]
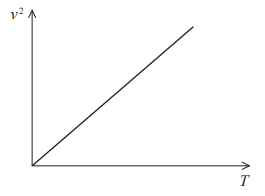
- 8. Corresponding values of [math]v^2[/math] against T are plotted. A straight-line graph is obtained, as shown.
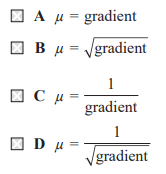
- Which of the following expressions for the mass per unit length μ of the string is correct?
- Answer: C
- Explain:
- The speed of a transverse wave on a stretched string is given by the formula:
- [math]v=\sqrt{(T/\mu)}[/math]
- [math](v)^2=(\sqrt{(T/\mu)})^2[/math]
- [math]v^2=T/\mu[/math]
- This equation can be rearranged to match the form of a straight-line graph,
- [math]y=mx+c[/math]
- In this case, the y-axis is [math]v^2[/math] and the x-axis is T.
- [math]v^2=(1/\mu)T+0[/math]
- – [math]y=v^2[/math]
- – [math]m=1/\mu[/math]
- – [math]x=T[/math]
- – [math]c=0[/math] (The graph passes through the origin, as shown in the image)
- The gradient of the graph is equal to 1/μ. To find the expression for μ the equation can be rearranged:
- [math]\mu=1/\text{gradient}[/math]
- 9. A resistance band is a length of an elastic material that can be used for exercise. The user repeatedly applies an increasing tensile force (loading) and then releases the force (unloading).
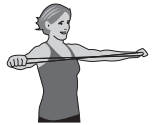
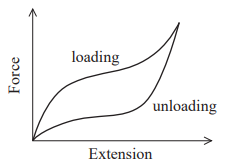
- The force-extension graph for the resistance band is shown.
- The user finds that the band gets warm during use.
Describe, with reference to the graph, the behaviour of the resistance band when it is repeatedly loaded and unloaded. (6) - Explain:
- The behavior of the resistance band is described by the hysteresis loop shown in the force-extension graph.
- The graph shows two distinct curves: one for loading and one for unloading.
- Loading:
- – As the tensile force is applied, the resistance band extends. The upper curve represents this process. The area under this curve represents the work done on the band to stretch it.
- Unloading:
- – When the force is released, the band contracts. The lower curve represents this process. The area under this curve represents the work done by the band as it returns to its original length.
- Analyze the force-extension graph
- The force-extension graph for the resistance band shows a hysteresis loop. The loading curve (the path taken when the force is applied and the band is stretched) is above the unloading curve (the path taken when the force is released and the band returns to its original length). This indicates that the work done to stretch the band is greater than the energy recovered when it is released.
- Relate the graph to the work done and energy converted
- The area under a force-extension graph represents the work done on the band.
- – The area under the loading curve represents the work done by the user to stretch the band.
- – The area under the unloading curve represents the elastic potential energy recovered from the band.
- – The area of the loop between the loading and unloading curves represents the difference between the work done and the energy recovered. This difference is the energy converted to other forms, such as thermal energy.
- Explain the observed warming
- The problem states that the band gets warm during use. This observation is consistent with the hysteresis loop shown in the graph. The work done by the user to stretch the band is not fully converted into elastic potential energy. The “lost” energy, represented by the area of the hysteresis loop, is converted into thermal energy, causing the temperature of the resistance band to increase. This is an example of an inelastic or non-perfectly elastic material.
- Result:
- The force-extension graph shows a hysteresis loop, where the loading curve is above the unloading curve. This indicates that the work done to stretch the band is greater than the elastic potential energy recovered when the force is released. The area of the loop between the loading and unloading curves represents the energy that is converted into thermal energy. This conversion of mechanical energy into heat is why the resistance band gets warm during repeated loading and unloading.
- 10. A student is investigating the extension of a spring.
- A force of 29 N is applied to the spring and it extends by 32 cm. The spring obeys Hooke’s law.
- (a) Calculate the work done on the spring. (2)
- Explain:
- – The extension of the spring = x = 32 cm =32/100 m=0.32 m
- – Force = F = 29 N
- – Work done = W = ?
- [math]W=1/2 Fx[/math]
- [math]W=1/2(29)(0.32)[/math]
- [math]W=1/2 (9.28)[/math]
- [math]W=4.6 J[/math]
- Work done = 4.6 J
- (b) Calculate the extension of the spring when a force of 27 N is applied.
- Explain:
- – Force, [math]F_1[/math]=29 N
- – Extension, [math]x_1[/math]=32 cm=0.32 m
- – Force, [math]F_2[/math]=27 N
- – Extension, [math]x_2[/math]=?
- By using the Hook’s Law:
- [math]F=kx[/math]
- [math]F_1=kx_1[/math]
- [math]F_1/x_1 =k[/math]……….(1)
- [math]F_2/x_2 =k[/math]……….(2)
- Comparing these equations:
- [math]F_1/x_1 =F_2/x_2[/math]
- [math]29/(0.32)=27/x_2[/math]
- [math]x_2=(0.32×27)/29[/math]
- [math]x_2=0.29 m[/math]
- [math]x_2=0.29 m[/math]
- [math]x_2=0.3 m[/math]
- Extension = 0.3 m
- 11. A student is carrying out an experiment to identify which type of glass a rectangular block is made from.
- The student shines a ray of light onto one surface of the rectangular block.
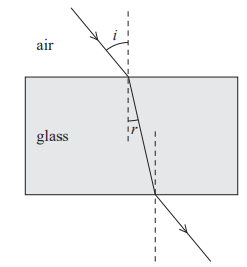
- The student marks the path of the ray on paper. He takes corresponding measurements of the angle of incidence i and the angle of refraction r at the air-glass interface.
- (a) State two precautions the student should take to improve the accuracy of these measurements.
- Explain:
- Two precautions the student should take to improve the accuracy of the measurements are:
- Avoid parallax error:
- – The student should ensure their eye is positioned directly above the point being measured on the protractor or paper. This prevents the apparent shift in position of an object when viewed from different angles, which can lead to incorrect readings.
- Use a sharp pencil and a narrow light ray:
- – Drawing thin, sharp lines for the incident and refracted rays, as well as the normal, improves the precision of the measurements. Using a narrow beam of light from the light source also helps in accurately marking the path of the ray.
- Other precautions could include ensuring the glass block is clean and free from smudges or scratches, which can scatter light, and making sure the glass block does not move during the experiment after its outline has been traced. The student should also take multiple readings and calculate the average to reduce random errors.
- (b) The student uses the protractor shown.
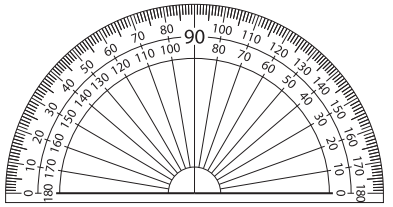
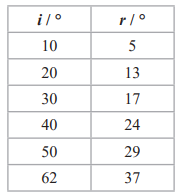
- He records his results in the table.
- (i) Comment on whether the student has recorded his measurements of i and r to the correct number of significant figures.
- Explain:
- The student’s recorded measurements for both i and r are given in the table. All the values are whole numbers, for example, [math]10^0[/math], [math]5^0[/math], [math]20^0[/math], [math]13^0[/math], etc.
- The recorded measurements are all to the nearest degree, which matches the resolution of the protractor. The number of significant figures is appropriate for the precision of the measuring instrument.
- – Resolution of protractor [math]1^0[/math]
- – Recognises that the results are recorded to the same precision as the resolution of the protractor.
- (ii) Calculate the percentage uncertainty in the value of r when i = [math]50^0[/math]
- Explain:
- The absolute uncertainty of a measurement is typically half of the smallest division of the measuring instrument. The protractor shown has a smallest division of [math]1^0[/math], Therefore, the absolute uncertainty is:
- [math]\Delta r=1/2\times1^0=0.5^0[/math]
- From the table provided in the image, when the angle of incidence (i) is [math]50^0[/math], the angle of refraction (r) is [math]29^0[/math].
- [math]r=29^0[/math]
- Calculate the percentage uncertainty
- The formula for percentage uncertainty is the absolute uncertainty divided by the measured value, multiplied by [math]100[/math]%.
- [math]\text{Percentage uncertainty}=\Delta r/r\times100[/math]%
- [math]\text{Percentage uncertainty}=0.5^0/29^0\times100[/math]%
- [math]\text{Percentage uncertainty}=1.72[/math]%
- [math]\text{Percentage uncertainty}=2[/math]%
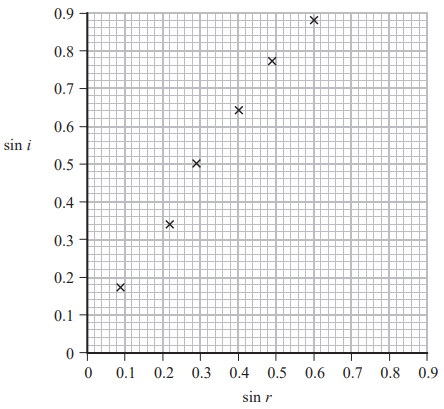
- (c) The student plots his results on a graph of sin i against sin r.
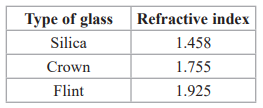
- The refractive index for three types of glass is shown.
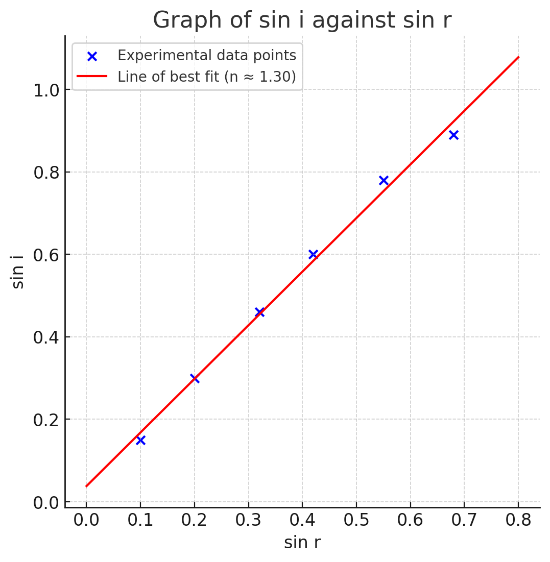
- (i) Draw a line of best fit. (1)
- Explain:
- (ii) Deduce which type of glass the rectangular block is made from. (3)
- Explain:
- According to Snell’s Law, the relationship between the angle of incidence (i) and the angle of refraction (r) is given by the equation:
- [math]n_1\sin i=n_2\sin r[/math]
- Where [math]n_1[/math] is the refractive index of the first medium (air, where [math]n_1 \approx 1[/math]) and [math]n_2[/math] is the refractive index of the second medium (the glass block).
- Rearranging the equation to match the graph’s axes (sin i on the y-axis and sin r on the x-axis), we get:
- [math]n_1\sin i=n_2\sin r[/math]
- [math]\sin i=n_2/n_1\sin r[/math]
- To find the gradient, we can use the line of best fit. The line of best fit should pass through the origin (0,0) and have a slope that best represents the plotted points. Using the point (0.6, 0.88), which is on the line of best fit, we can calculate the gradient:
- [math]m=\Delta y/\Delta x[/math]
- [math]m=(0.88-0)/(0.6-0)[/math]
- [math]m=0.88/0.6[/math]
- [math]m=1.47[/math]
- Compare the calculated refractive index of [math]1.47[/math] with the values given in the table:
- – Silica: [math]1.458[/math]
- – Crown: [math]1.755[/math]
- – Flint: [math]1.925[/math]
- The calculated value of [math]1.47[/math] is closest to the refractive index of Silica ([math]1.458[/math]).
- The calculated gradient is approximately [math]1.47[/math], which is within the range of [math]1.37[/math] to [math]1.47[/math]. This value is closest to the refractive index of Silica ([math]1.458[/math]) from the table. Therefore, the rectangular block is made from Silica glass.
- Type of glass = Silica